Whitman Sees Ten-Year High in Applications
February 27, 2018
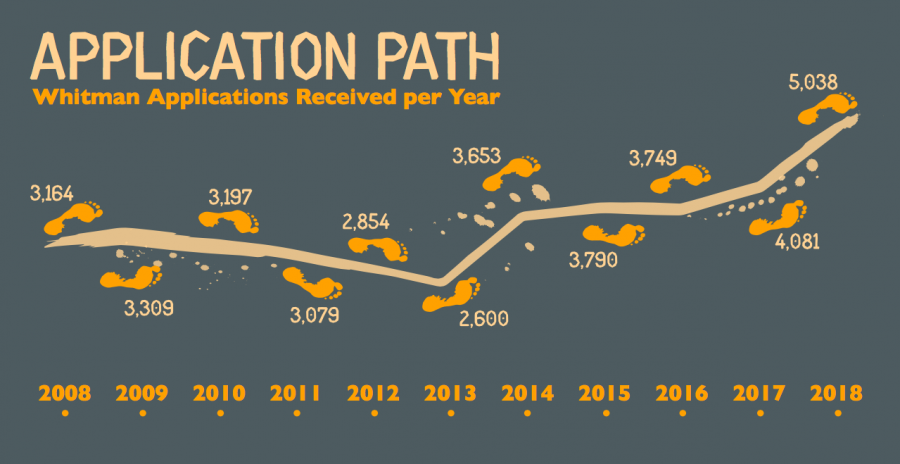
Whitman’s admission office has published data about students applying to enroll for the 2018-2019 academic year. This year, 5,042 students applied, an increase from last year’s 4,081 applicants. In the context of under enrollment amongst the current First-Year class–409 students, 26 shy of the 435 budgeted for–this likely prompted a collective sigh of relief from the admissions department.
The failure in recent years to meet enrollment goals resulted in budgetary constraints that have forced the College to dip into the contingency fund. This created a tense atmosphere for the admissions team to get enrollment back on track.

Peter Harvey, Whitman’s Chief Financial Officer, offered a summation of the school’s general efforts to re-balance in response to the underenrollment of the current class, writing in an email to The Wire:
“We have taken several steps: We’ve adjusted the budget expectations for next year to assume a smaller first year class with a higher financial aid budget to recruit the class. We’ve worked hard to increase applications which are up over 25 percent this year,” And, finally, “We are adjusting the number of students we admit to reflect declining yield most liberal arts colleges are experiencing.”
Josh Jensen, Vice President for Enrollment and Communications, shed further light on what the ‘hard work’ that Harvey referenced looked like for the recruitment team, specifically honing in on what Whitman has done differently this year.
“A big focus this year has been ramping up communications, and going out of our way to let prospective students know how much we value their interest in Whitman … For the first time this year, we have not just a packet for admitted students, but a box with some Whitman swag to welcome them to our community and build their excitement,” Jensen said. “We are doubling the number of times we’re reaching out admitted students between March and May, and making sure that our messages address the biggest questions and concerns of admitted students.”
These efforts to increase applicants were largely successful, resulting in a 24 percent uptick.
Though still awaiting causal analysis, Adam Miller, the College’s Director of Admission, presently believes this increase to be attributable to three causes, writing:
“First, our application did not include a supplemental essay this year; second, there was a large increase in international applicants; lastly, over the past couple years we have spent a lot of time enhancing our communications and recruitment efforts.”
The elevated number of international applicants is perhaps the most striking change. In 2016, 551 international students applied, 687 the following year and a whopping 1,197 in this year’s class. That figure beats out both California and Washington (1,070 and 1,009, respectively) and accounts for 24 percent of the total applicant pool. This year’s increase in international applicants (444) is responsible for 46 percent of the total growth (961).
International applications have been steadily increasing for some time. After hitting a low of 284 (10 percent of total pool) in 2012, applications rose for the next five years, reaching 687 (16.8 percent) in 2017 before jumping to this year’s figure.
But even with this uptick in International applications, the domestic application pool remained overwhelmingly caucasian. Application numbers for domestic students of color have been fairly stagnant the past two years (1,018 and 1,138 in 2016 and ‘17, respectively) and do not disappoint in doing so again this year, matching last year’s figure exactly, despite the increase in total applications.
Efforts to diversify have yielded some results, but improvements have been marginal (e.g. Black/African-American applicants: 44 in 2013, 89 in 2017). Though that is an increase, the figure remained a mere 2.2 percent of the total in 2017.
Along with the roughly 60-40 female to male ratio, the lack of racial diversity in the applicant pool remains constant even as Whitman draws in more applications. In 2008, the applicant pool was 58 percent female and in 2017, 60 percent. In 2018, it was 59 percent white then in 2017, 63.2 percent.


